Purpose: Although homogeneous according to TNM staging system, stage III NSCLC patients form a heterogeneous group, which is reflected in the survival outcome. The increasing amount of information for an individual patient and the growing number of treatment options facilitate personalized treatment, but also complicate treatment decision making. Decision Support Systems (DSS), providing individualized prognostic information, can overcome this, but are currently lacking. A DSS for stage III NSCLC requires development and integration of multiple models. The current study takes the first step in this process by developing and validating a model that can provide physicians with a survival probability for an individual NSCLC patient.
Methods and Materials: Data of 548 stage III NSCLC patients were available to develop a prediction model, using stratified Cox regression. Variables were selected using a bootstrap procedure. Performance of the model was expressed as the c-statistic, assessed internally and on two external datasets (n=174 and 130).
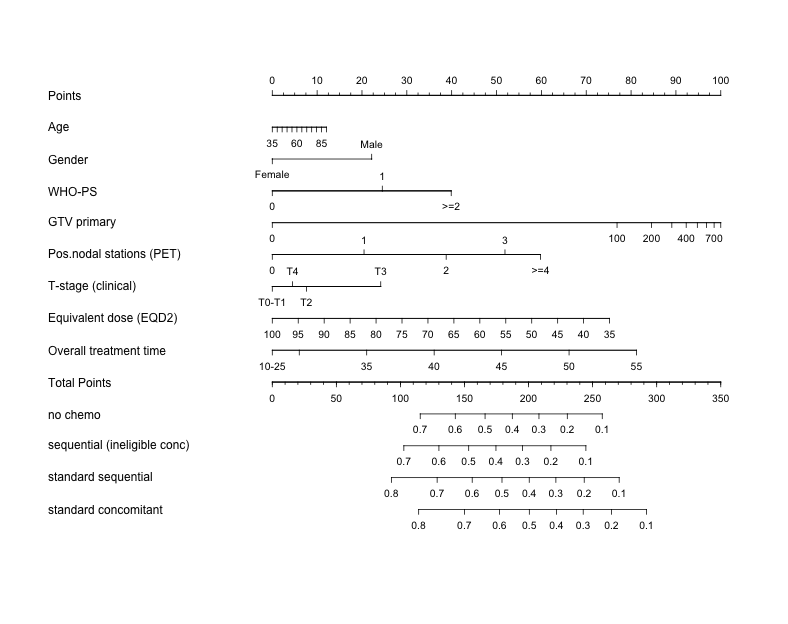
Results: The final multivariate model, stratified for treatment, consisted of age, gender, WHO performance status, overall treatment time, equivalent radiation dose, number of positive lymph node stations and gross tumor volume. The bootstrapped c-statistic was 0.62. The model could identify risk groups in external datasets. Nomograms were constructed to predict an individual patient’s survival probability (see figure). The dataset can be downloaded below.
Conclusions: The prediction model for overall survival of stage III NSCLC patients highlights the importance of combining patient, clinical and treatment variables. Nomograms were developed and validated. This tool could be used as a first building block for a Decision Support System.

Nomogram for prediction of 36 months overall survival.
Instructions for physician: Locate the patient’s age on the age axis. Draw a line straight upward to the points axis to determine how many points a patients receives for age. Repeat this process for the other axes, each time drawing straight upward to the points axis. Sum the points achieved for each predictor and locate this sum on the “Total points” axis. Draw a line straight down to assess the survival probability for this patient.
| Attachment | Size |
|---|---|
| 25.9 KB | |
| 66.67 KB | |
| 51.15 KB |